
This indicator allows for interannual and monthly comparisons of the hours billed and the amounts billed in the workshop. It can be obtained both at the workshop level and for each mechanic.
This indicator can be used to make comparisons of billing levels of mechanics in amounts and amounts of hours billed. In the comparison between mechanics, it is useful to see the average billing in the month and know if any that is below or above the average.
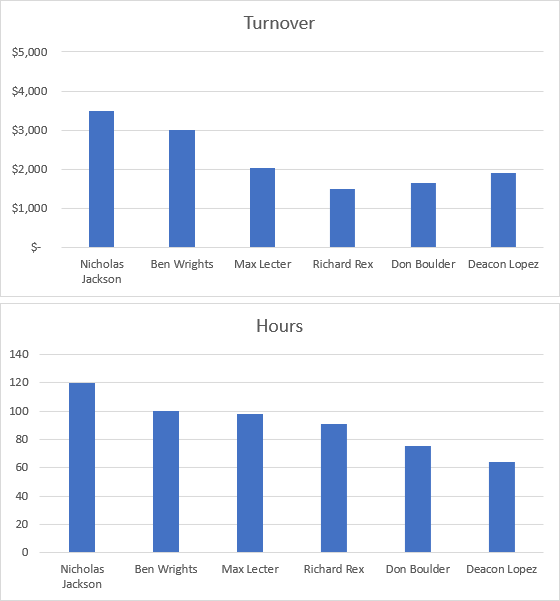
In this graph, for example, the dealership analyzes the hours billed and the monthly amounts. With that information you can define a baseline that is the target for your operators. Each time you analyze the results, you can detect whether or not there are operators who are close to the goal and take action to achieve it.
Do you know Autologica Sky DMS?
Autologica Sky DMS is a software for the automotive and machinery industry with all the functions and integrations that professional dealerships need.
» Request a demo
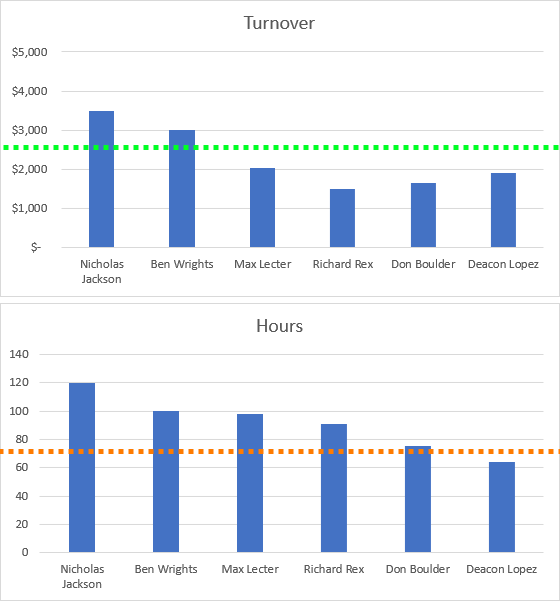
In addition to the average line, a target or benchmark line can also be added. In this way, you will analyze the billing according to the average of all your operators, but you will also be able to know how far or close they are from the goal.
Another analysis would be to compare the billing month by month to see if the billing has been growing or even comparing the current year versus the previous year (or current month versus the same month of the previous year). In those economies with an inflationary context, it is possible to compare the hours billed and not the amounts, to verify the evolution of this indicator over time.