
A simple way to know if we are growing is to look at the increase in revenue from one month to the next.
But if we want to dig deeper and see the origin of that result, its composition and trends, and obtain information to make decisions, the immense volume of data generated by the dealership makes it harder.
With the advent of Business Intelligence, business dimensions and variables that were previously difficult to calculate and analyze became crucial. One of the most important variables is the analysis of variations in revenue trends. This is a key point in order to understand customer habits.
In this article we will analyze the variation of revenue and the conclusions that we can obtain.
A real world scenario
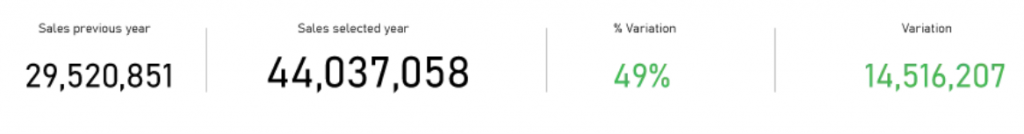
Let’s look at the Parts Department at a dealership. Between 2018 and 2019 there was an increase of $14,516,207 in sales, which meant a 49% variation.
What did the dealership’s parts analyst do? First, they studied the variation chart that allowed them to draw quick conclusions about the behavior of sales.
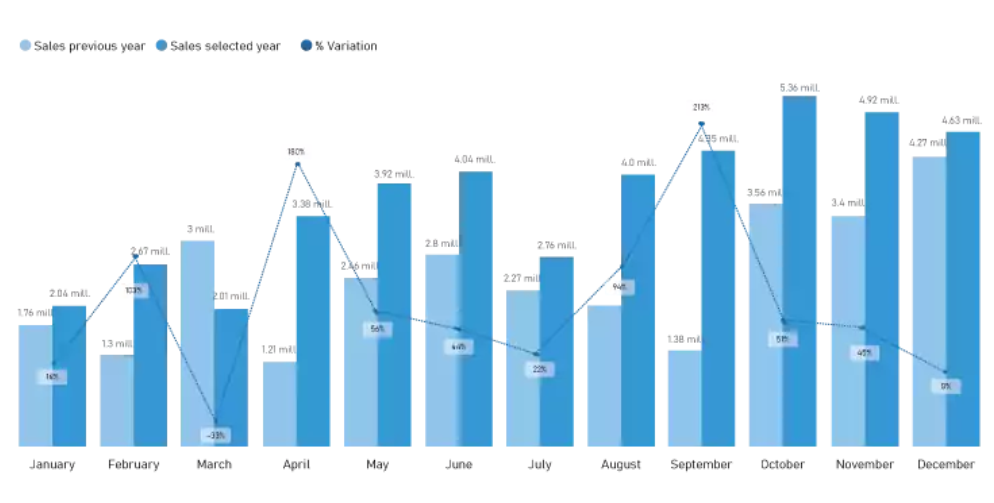
- January and February | Year over year sales were higher year, and the growth in variation was also on the rise.
- April, May, June and July | Sales also increased compared to the previous year, but growth was less and less. There was a drop in variation.
- Was this downward trend a circumstantial event or did it repeat in previous years? By comparing with the same information in previous years, the analyst can detect a cyclical situation to address.
- Another question the analyst may ask: This occurred at the overall dealership level, but what happened at each store?
This last question was key to investigate exactly how this 49% annual growth was reached from the analysis of each store.
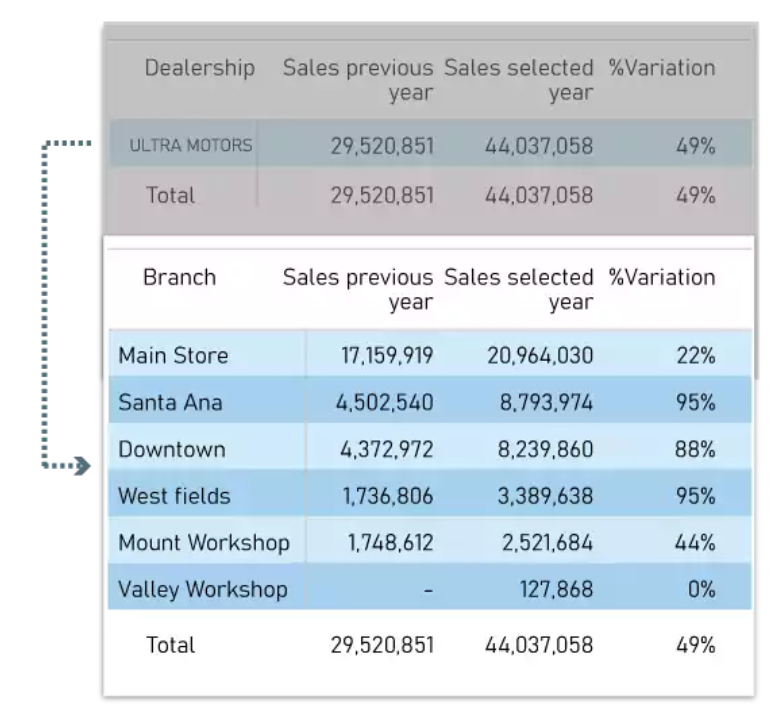
Although the main store was the one with the highest sales, it grew only 22% while the other stores had an average growth of 80%. This situation raises questions and poses new scenarios for analysis.
Transform analytics into sales
The drill down and drill up offered by a Business Intelligence application is the best ally when it comes to tracing results to their origins, and transforming data analysis into concrete sales.

On this screen, the analyst can see:
- The variation of sales for each customer
- For each customer, what purchases were made the previous year and not yet this year, in order to offer them those products
This allows detecting if a customer, for example, has lowered their purchase amount over time. The parts analyst can sort the columns according to different criteria to find detailed features and behaviors.
Conclusion
With Autologica Business Intelligence, dealership data can be transformed into smart decisions and actions. This complete and real-time look of what is happening with dealership sales is a tactical advantage in a hyper-competitive market.
Reaching this level of detail allows us to know if the variations are random, or the product of our premeditated efforts. And working on these variables is what differentiates top performers.
You already have the necessary business data… why not use it to make strategic decisions?
Give your team the tools that will help them make smart decisions; request a demo today.